Market Update for the Quarter Ending March 31, 2022
Positive March Wraps Shaky Quarter for Markets
Equity markets partially bounced back in March, driven by a strong run in the second half of the month. The S&P 500, Dow Jones Industrial Average (DJIA), and Nasdaq Composite gained 3.71 percent, 2.49 percent, and 3.48 percent, respectively. Despite the solid results in March, all three indices finished the quarter in the red due to drops in January and February. The S&P 500 lost 4.60 percent in the first quarter, the DJIA dropped 4.10 percent, and the technology-heavy Nasdaq Composite fell 8.95 percent.
These weak quarterly results came despite improving fundamentals. Per Bloomberg Intelligence, as of March 25, 2022, with 99 percent of companies having reported actual earnings, the average earnings growth rate for the S&P 500 in the fourth quarter was 28.9 percent. This is well above analyst estimates for a 19.8 percent earnings growth rate at the start of earnings season, indicating that businesses continued to operate successfully despite rising medical risks at the end of last year. Fundamentals drive long-term market performance, so better-than-expected quarterly results are a good sign for investors.
Technical factors were mixed at quarter-end. The S&P 500 finished the month above its 200-day moving average; however, the Nasdaq Composite and DJIA both finished the month below trend, marking two consecutive months where both have finished below their respective 200-day averages. The S&P 500 fell below its trendline at the end of February before recovering above trend toward the end of March. The 200-day moving average is an important technical trendline, as extended periods above or below trend can signal shifting investor sentiment for an index. While it’s too soon to say if investors have soured on U.S. markets, especially given the rebound in March, technical factors will be worth monitoring in the months ahead.
International markets were mixed during the month but still ended the quarter in negative territory. The MSCI EAFE Index gained 0.64 percent in March but declined 5.91 percent for the quarter. The MSCI Emerging Markets Index fell 2.22 percent during the month, capping off a loss of 6.92 percent for the quarter. Technical factors for international equities were weak, with the MSCI EAFE and MSCI Emerging Markets indices ending the quarter below their respective 200-day moving averages. This marks three months where both indices finished below trend, signaling investor concern for international equities.
Even fixed income markets struggled to start the year, as rising interest rates negatively impacted bond prices throughout the month and quarter. The 10-year U.S. Treasury yield started the year at 1.63 percent, increased to 1.72 percent by the start of March, then surged to 2.32 percent by month-end. Short-term interest rates also experienced notable upward pressure throughout the quarter, driven by rising expectations for more rate hikes from the Federal Reserve (Fed) during the year. The Bloomberg U.S. Aggregate Bond Index dropped 2.78 percent for the month and 5.93 percent for the quarter.
High-yield fixed income also saw declines, with the Bloomberg U.S. Aggregate Corporate High Yield Bond Index down 1.15 percent in March and 4.84 percent for the quarter. High-yield credit spreads saw large movements throughout the quarter, starting the year at 3.05 percent and reaching a high of 4.21 percent in mid-March before retreating to 3.33 percent at quarter-end. Rising spreads are a sign that investors are becoming cautious and demanding more yield to invest in bonds with lower credit quality.
Risks Change During Quarter
We saw the risks to economic recovery and markets shift throughout the course of the quarter. Declining medical risks were offset by more aggressive plans from the Fed to tighten monetary policy this year as well as the uncertainty created by the Russian invasion of Ukraine.
Medical risks fell notably during the quarter when the impact from the Omicron variant peaked in mid-January before swiftly declining by quarter-end. We ended the quarter with average daily new cases at their lowest level since last July, which is an encouraging sign that high levels of vaccination and natural immunity from previous exposure helped blunt the impact from the variant. While it’s possible that we’ll see additional waves of Covid-19 in the future, the recent muted economic impact from Omicron highlights an increased ability for the economy to withstand periods of high levels of case growth.
While we’ve made progress in controlling pandemic-related medical risks, we saw rising risks in other areas that negatively impacted markets during the month and quarter. Inflation remains stubbornly high throughout the economy, driven by high levels of demand and supply chain shortages. Inflation levels caused the Fed to hike interest rates at their March meeting, which marked the first interest rate hike since 2018. Fed members have also accelerated their projections for future rate hikes, with most economists and investors expecting a series of hikes throughout the course of the year. While rate hikes are a sign that the Fed is comfortable with the current health of the economy, they can also lead to lowered valuations and did play a part in the sell-off we saw last quarter.
Geopolitical risks also increased during the quarter, most notably surrounding Europe following the Russian invasion of Ukraine in late February. The conflict continued through the end of March and rattled markets. While the immediate economic impact to the U.S. has been largely limited outside of higher energy and food prices, the uncertainty created by the invasion negatively impacted markets and serves as a reminder that risks can come from unexpected places at any time.
Economic Momentum Continues Despite Risks
Despite the shifting quarterly risk profile, economic data releases in March showed continued economic growth with last year’s positive momentum carried over in 2022. The March job report showed that 431,000 jobs were added during the month, contributing to more than 1.68 million jobs that were created during the quarter. The impressive hiring growth to start the year helped drive the unemployment rate to a 2-year low of 3.6 percent by the end of March, signaling a strong labor market that has helped drive overall growth to start the year.
Consumer spending increased in January and February, which was an encouraging sign that consumers remain willing and able to spend. Retail sales growth was especially impressive as sales increased 4.9 percent in January and another 0.3 percent in February. Consumer spending is the backbone of the American economy, so this was a good indicator for the health of the overall economy to start the year.
Business confidence and spending also held up well despite rising quarterly risks. Manufacturing and service sector confidence remained in healthy expansionary territory throughout the quarter, which helped support continued business investment. Output also showed signs of recovery once medical risks declined, as seen by the 1.2 percent increase in manufacturing production in February.
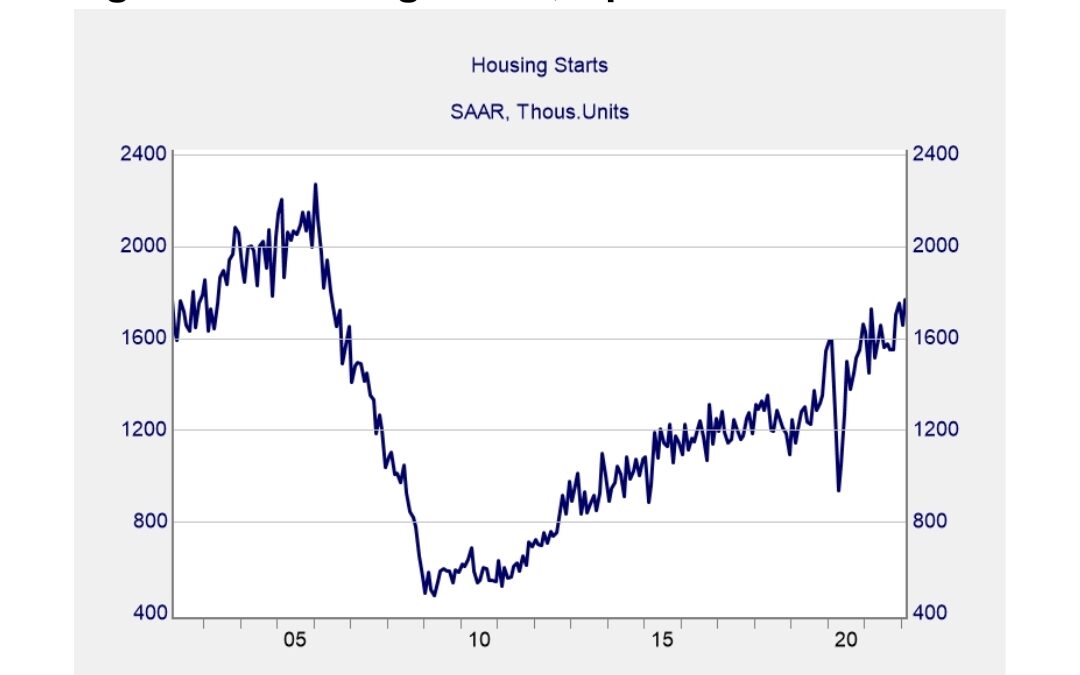
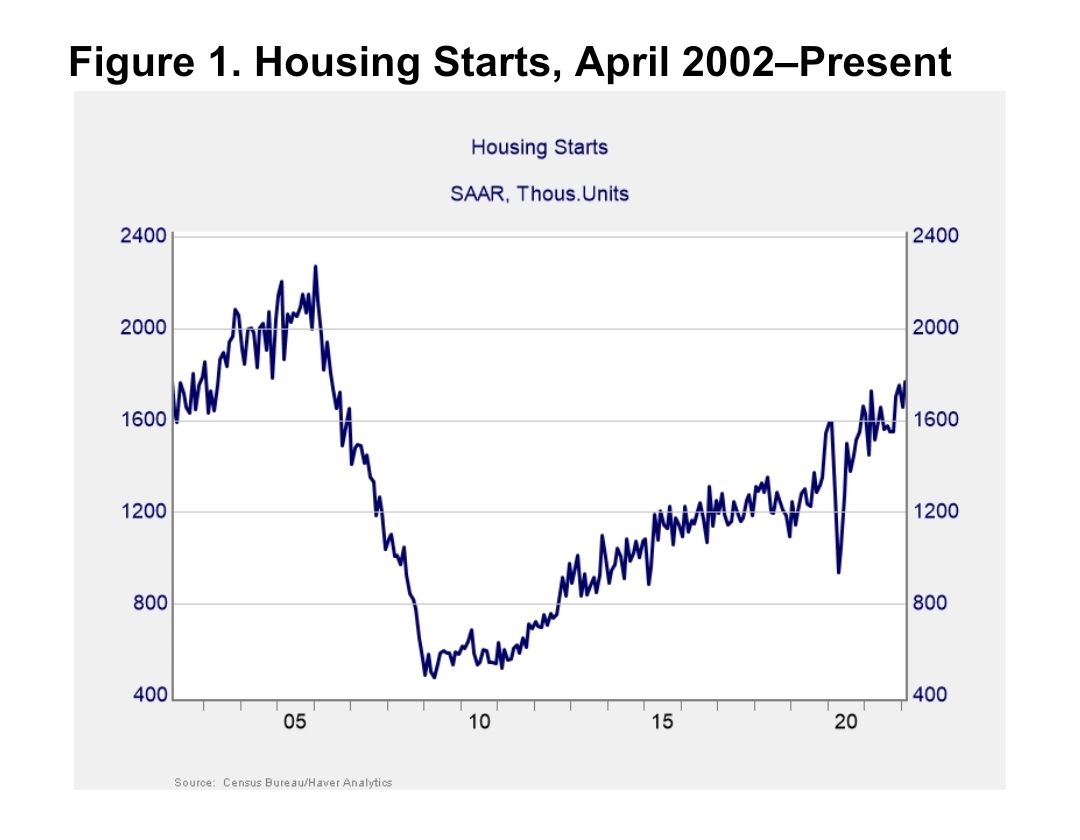
New home construction was also impressive to start the year, supported by high levels of demand for housing and a shortage of existing homes for sale. As you can see in Figure 1, the pace of new home construction hit its highest level since 2006 in February. The housing sector has been one of the bright spots in economic recovery following the expiration of initial lockdowns in spring 2020 and continued construction growth is a healthy sign for the market. That said, rising mortgage rates and prices may slow the sector in the months ahead.
Continued Growth Expected
The first quarter served as a reminder that real risks to the economy and markets remain despite solid progress that we made on both medical and economic fronts to start the year. The expectation for tighter monetary policy throughout the year will likely continue to weigh on markets, especially if the Fed surprises investors with the pace of rate hikes. Additionally, the uncertainty from the Russian invasion of Ukraine could lead to further market selloffs if the conflict gets worse. Although risks remain, the most likely path forward for the U.S. economy and markets is further growth.
The reports in March encouragingly showed that the economy remains on solid footing despite shifting risks that we’ve seen so far this year. We remain in a healthy place, with the impressive labor market recovery over the past two years driving much of the fundamental improvement.
Businesses have also shown that they’re capable of operating at a high level despite the headwinds created by rising rates and geopolitical uncertainty. Earnings growth is expected to slow in 2022 compared to 2021, but slow growth is still growth and would help support markets in the long term.
Ultimately, while negative headlines and shifting risks may lead to further short-term turbulence for markets, strong fundamentals and continued economic recovery should help support markets over the long term. Given the potential for short-term selloffs, it’s important to remember a well-diversified portfolio that matches investor timelines with goals remains the best path forward for most. If concerns remain, you should reach out to your financial advisor to discuss your financial plans.
All information according to Bloomberg, unless stated otherwise.
Disclosure: Certain sections of this commentary contain forward-looking statements based on our reasonable expectations, estimates, projections, and assumptions. Forward-looking statements are not guarantees of future performance and involve certain risks and uncertainties, which are difficult to predict. Past performance is not indicative of future results. Diversification does not assure a profit or protect against loss in declining markets. All indices are unmanaged and investors cannot invest directly into an index. The Dow Jones Industrial Average is a price-weighted average of 30 actively traded blue-chip stocks. The S&P 500 Index is a broad-based measurement of changes in stock market conditions based on the average performance of 500 widely held common stocks. The Nasdaq Composite Index measures the performance of all issues listed in the Nasdaq Stock Market, except for rights, warrants, units, and convertible debentures. The MSCI EAFE Index is a float-adjusted market capitalization index designed to measure developed market equity performance, excluding the U.S. and Canada. The MSCI Emerging Markets Index is a market capitalization-weighted index composed of companies representative of the market structure of 26 emerging market countries in Europe, Latin America, and the Pacific Basin. It excludes closed markets and those shares in otherwise free markets that are not purchasable by foreigners. The Bloomberg Aggregate Bond Index is an unmanaged market value-weighted index representing securities that are SEC-registered, taxable, and dollar-denominated. It covers the U.S. investment-grade fixed-rate bond market, with index components for a combination of the Bloomberg government and corporate securities, mortgage-backed pass-through securities, and asset-backed securities. The Bloomberg U.S. Corporate High Yield Index covers the USD-denominated, non-investment-grade, fixed-rate, taxable corporate bond market. Securities are classified as high-yield if the middle rating of Moody’s, Fitch, and S&P is Ba1/BB+/BB+ or below.
Authored by Brad McMillan, CFA®, CAIA, MAI, managing principal, chief investment officer, and Sam Millette, manager, fixed income, at Commonwealth Financial Network®.
© 2022 Commonwealth Financial Network®