
Quick Hits
- Tricks Not Treats for Markets in October
- Fixed Income Falls
- Economy Grows but Shows Signs of Slowing
- Housing Continues to Slow
- Risks to Monitor
- Outlook Broadly Positive
Tricks Not Treats for Markets in October
Equity markets continued to drop in October, with all three major U.S. indices down for the third consecutive month. The S&P 500 lost 2.1 percent while the Dow Jones Industrial Average declined
1.26 percent. The Nasdaq Composite saw the largest drop, with the technology-heavy index down
2.76 percent in October and rising long-term interest rates weighing on stock valuations.
Despite the continued slide for stocks in October, fundamentals showed improvement. According to Bloomberg Intelligence, as of October 31, 2023, with 58 percent of companies having reported actual earnings, the blended earnings growth rate for the S&P 500 in the third quarter stood at 2.8 percent. This is notably better than analyst estimates for a 1.2 percent drop in earnings growth for the quarter and would represent the first quarter with year-over-year earnings growth since the third quarter of 2022—if results hold. Fundamentals drive long-term market performance, so this better-than-expected result is a good sign for investors.
While fundamental factors were supportive during the month, technical factors were mixed. Both the S&P 500 and DJIA ended below their respective 200-day moving averages in October, while the Nasdaq finished just above trend due to a late-month rally. The 200-day moving average is a widely followed technical signal, as prolonged breaks above or below this level can signal shifting investor sentiment for an index. This is the first time that two of the three major indices have ended a month below trend this year.
The story was similar internationally during the month, as rising rates weighed on international stocks. The MSCI EAFE Index dropped 4.05 percent while the MSCI Emerging Markets Index was down
3.87 percent. Technical factors were also a headwind for international markets in October, with both indices finishing below their respective 200-day moving averages.
Fixed Income Falls
Fixed income markets also suffered losses during the month, driven primarily by rising long-term interest rates. The 10-year U.S. Treasury yield rose from 4.59 percent at the end of September to 4.88 percent by the end of October, which put pressure on bond prices. The Bloomberg Aggregate Bond Index lost
1.58 percent in October.
High-yield fixed income also experienced losses during the month, driven by rising rates and widening credit spreads. The Bloomberg U.S. Corporate High Yield Index lost 1.16 percent in October. High-yield credit spreads increased notably, rising from 4.03 percent at the end of September to 4.50 percent by the end of October. Widening credit spreads indicate that investors became more risk-averse in October, which was in-line with the continued sell-off in equities.
Economy Grows but Shows Signs of Slowing
Despite the challenging month for markets, the economic updates released during the month showed signs of continued growth. The first look at third-quarter gross domestic product (GDP) growth showed a very strong 4.9 percent annualized growth rate for the economy, up from the 2.1 percent second-quarter growth rate. This strong growth was supported by a rise in personal consumption growth during the quarter, which was supported by the positive labor market.
September’s employment report showed a surge in hiring, with 336,000 jobs added during the month against calls for a more modest 170,000. As you can see in Figure 1, this represented the best month of job growth since January of this year. The better-than-expected result highlighted the continued strength of the labor market to end the third quarter. The healthy labor market helped support continued consumer spending growth, with retail sales and personal spending both coming in above expectations in September.
Figure 1. Nonfarm Payroll Employment Change, October 2020–Present
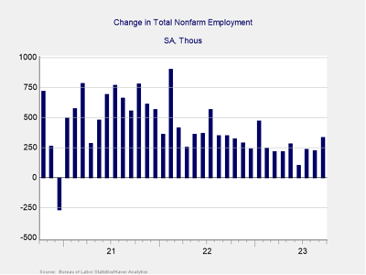
Source: Bureau of Labor Statistics/Haver Analytics
While recent updates pointed toward faster economic growth in September, there are signs that growth may be set to slow looking forward. Consumer confidence fell in October, with market declines, high fuel costs, and a slowing housing sector weighing on sentiment. The Conference Board Consumer Sentiment Index fell to a five-month low during the month, which could serve as a headwind for consumer spending growth ahead. Given the importance of consumer spending on the overall economy, this will be an important area to monitor as we finish out the year.
The Takeaway
- Hiring and spending remained strong in September.
- Falling confidence could signal slower growth ahead.
Housing Continues to Slow
One area that has already seen a notable slowdown this year is housing. A combination of high prices, rising mortgage rates, and limited supply of homes for sale have combined to lower prospective home buyer demand and overall activity in the sector.
The pace of existing home sales fell to its lowest level since 2010 in September, with the 3.96 million annualized sales rate down notably from the recent high of 6.56 million in January 2021. This slowdown in housing sales has filtered into the rest of the housing sector, with home builder sentiment dropping to a nine-month low in October. The pace of new home construction has also slowed compared to 2022.
The primary factor in this housing slowdown continues to be high mortgage rates. We started the year with an average 30-year mortgage rate of 6.6 percent, which was already well above the lows of under
3 percent that we saw in early 2021. Since the start of the year, we’ve seen mortgages rates rise to just over 8 percent in October. Rising mortgage rates have also served as a headwind for prospective home buyers.
The housing sector is an important area of the economy given the knock on spending associated with housing sales as well as the large impact that housing costs have on inflation calculations. While the slowdown in housing sales and construction this year has slowed overall short-term growth, it should help support lower inflationary pressure looking forward.
The Takeaway
- The housing sector has slowed notably this year.
- While slowing housing sales may hold back immediate economic growth, they may also help support slowing inflation.
Risks to Monitor
While the positive economic updates were a welcome development, the continued market turbulence in October served as a reminder that real risks remain for investors. Domestically, the largest risk is a potential rise in inflation and interest rates toward year-end. While year-over-year figures showed improvement in September, monthly inflation reports showed signs of increased price pressure due in part to rising gas prices. This continued sticky inflation was one of the factors that contributed to the rise in long-term interest rates during the month, which negatively impacted both fixed income and equity returns.
While energy prices generally declined throughout October, the September rise in headline consumer price growth indicates there is still real work to be done to get inflation and prices back to the Federal Reserve (Fed)’s 2 percent target.
International risks remain as well, highlighted by Russia-Ukraine and Israel-Hamas wars. While neither conflict has had a lasting impact on markets yet, the risk for escalation and uncertainty remains. Additionally, concerns about slowing growth in China persist following widespread defaults across the country’s property development sector. Here, too, the damage has largely been limited in scale and scope; however, this is another risk worth paying attention to given China’s importance to the global economy.
The Takeaway
- Inflation and interest rates remain the primary domestic risks for investors.
- The ongoing Russia-Ukraine and Israel-Hamas wars highlight current international risks, along with the slowdown in China.
Outlook Is Broadly Positive
Despite the market declines in October, the overall outlook remains positive. The return to earnings growth in the third quarter is a welcome sign that businesses are continuing to benefit from the solid economic backdrop. Additionally, while there are signs of potential slower growth ahead, it’s important to remember that slower growth is still growth and that, on the whole, the economy remains healthy.
While September and October were volatile months for investors, this is often the case when you look back at historical performance. Typically, markets tend to rally toward year-end, which may help support investor portfolios in the months ahead. Ultimately, given the improving fundamentals and a backdrop of economic growth, markets should be well set up for the intermediate to long run.
With that said, short-term risks that could lead to temporary turbulence remain. A well-diversified portfolio that aligns investor goals with timelines remains the best path forward for most. As always, you should reach out to your financial advisor to discuss your current plan if you have concerns.
Disclosure: Certain sections of this commentary contain forward-looking statements based on our reasonable expectations, estimates, projections, and assumptions. Forward-looking statements are not guarantees of future performance and involve certain risks and uncertainties, which are difficult to predict. Past performance is not indicative of future results. Diversification does not assure a profit or protect against loss in declining markets. All indices are unmanaged and investors cannot invest directly into an index. The Dow Jones Industrial Average is a price-weighted average of 30 actively traded blue-chip stocks. The S&P 500 Index is a broad-based measurement of changes in stock market conditions based on the average performance of 500 widely held common stocks. The Nasdaq Composite Index measures the performance of all issues listed in the Nasdaq Stock Market, except for rights, warrants, units, and convertible debentures. The MSCI EAFE Index is a float-adjusted market capitalization index designed to measure developed market equity performance, excluding the U.S. and Canada. The MSCI Emerging Markets Index is a market capitalization-weighted index composed of companies representative of the market structure of 26 emerging market countries in Europe, Latin America, and the Pacific Basin. It excludes closed markets and those shares in otherwise free markets that are not purchasable by foreigners. The Bloomberg Aggregate Bond Index is an unmanaged market value-weighted index representing securities that are SEC-registered, taxable, and dollar-denominated. It covers the U.S. investment-grade fixed-rate bond market, with index components for a combination of the Bloomberg government and corporate securities, mortgage-backed pass-through securities, and asset-backed securities. The Bloomberg U.S. Corporate High Yield Index covers the USD-denominated, non-investment-grade, fixed-rate, taxable corporate bond market. Securities are classified as high-yield if the middle rating of Moody’s, Fitch, and S&P is Ba1/BB+/BB+ or below.
Authored by Brad McMillan, CFA®, managing principal, chief investment officer, and Sam Millette, director, fixed income, at Commonwealth Financial Network®.
© 2023 Commonwealth Financial Network