
Quick Hits
- September Sell-off Caps Challenging Quarter
- Fixed Income Falters as Rates Rise
- Economic Growth Continues
- Shutdown Uncertainty Highlights Continued Market Risks
- Solid Foundation for the Fourth Quarter
September Sell-off Caps Challenging Quarter
Equity markets fell for the second consecutive month in September, causing all three major U.S. indices to end the month and quarter in the red. The S&P 500 lost 4.77 percent for the month and 3.27 percent for the quarter. The Dow Jones Industrial Average (DJIA) was down 3.42 percent in September and 2.10 percent for the quarter. The Nasdaq Composite saw the largest declines, with the technology-heavy index dropping 5.77 percent for the month and 3.94 percent for the quarter. Rising rates and concerns surrounding a potential government shutdown at month-end weighed on equities.
Despite market declines in September, earnings reports showed signs of better-than-expected fundamental performance throughout the quarter. Per Bloomberg Intelligence, as of September 14, 2023, the blended earnings decline for the S&P 500 was 5.8 percent in the second quarter. This result was notably better than the 9 percent decline expected at the start of earnings season. Fundamentals drive long-term performance, so the smaller-than-anticipated decline was a positive development for markets.
Technical factors were mixed in September, with the S&P 500 and Nasdaq Composite finishing the month above their respective 200-day moving averages while the DJIA finished the month below trend (marking the first time any of the three major U.S. indices has ended a month below trend this year). The 200-day moving average is a widely followed technical signal, as prolonged breaks above or below this level can signal shifting investor sentiment for an index. While a single month below trend is not an immediate concern for investors, technical factors will bear monitoring in the months ahead.
International markets also experienced declines during the month and quarter. The MSCI EAFE Index dropped 3.42 percent in September and 4.11 percent throughout the quarter. The MSCI Emerging Markets Index was likewise down 2.58 percent for the month and 2.79 percent for the quarter. Both international indices ended the month below their respective 200-day moving averages. This is the first time both indices have finished a month below trend this year.
Fixed Income Falters as Rates Rise
Fixed income markets also experienced declines in September, as rising interest rates weighed on bond prices. The 10-year U.S. Treasury yield rose from 4.03 percent at the end of August to 4.59 percent at the end of September. The Bloomberg Aggregate Bond Index lost 2.54 percent for the month and 3.23 percent for the quarter.
The Federal Reserve (Fed) kept the federal funds rate unchanged at its September meeting, but Fed Chair Jerome Powell indicated in his post-meeting press conference that the Fed may hike rates further this year and keep them higher for longer, if deemed necessary, to combat inflation. While this echoes previous messages from the central bank, rising investor expectations for tighter monetary policy helped drive yields up in September.
High-yield fixed income also experienced declines in September. The Bloomberg U.S. Corporate High Yield Index lost 1.18 percent in September. Despite the decline last month, the index managed to eke out a 0.46 percent gain for the quarter. High-yield bond spreads rose from 3.85 percent at the end of August to 4.09 percent at the end of September, signaling rising investor caution.
Economic Growth Continues
September’s economic updates showed signs of continued economic growth. The August job report showed solid job growth, with the labor force participation rate rising to a three-year high in August while the unemployment rate remained low. The healthy labor market supported personal income and spending growth in August, as well as better-than-expected retail sales growth. While consumer confidence fell in September, spending has stayed resilient throughout the course of the year despite shifting sentiment.
Business spending also showed signs of improvement in September. Headline and core durable goods orders both increased more than expected in August, marking four consecutive months with rising business investment. Business confidence also improved, with both manufacturer and service sector confidence increasing more than expected.
We also saw improving inflation data. While headline consumer inflation accelerated in August due to rising food and energy costs, core inflation continued to fall. As shown in Figure 1, core consumer inflation fell to 4.3 percent on a year-over-year basis in August, marking the smallest year-over-year increase since September 2021. While there is still real work to be done to get inflation back to the Fed’s 2 percent target, the improvements that we’ve seen so far this year indicate that we’re making progress in the fight against inflation.
Figure 1. CPI-U: All Items Less Food and Energy, YOY % Change, September 2012–Present
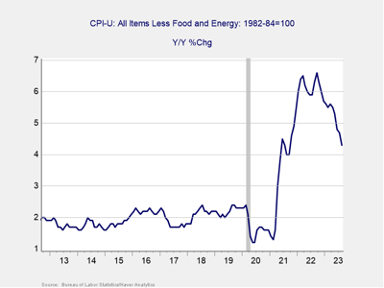
Source: Bureau of Labor Statistics/Haver Analytics
All-in-all, the economic data was largely positive in September. If we continue to see economic growth with slowing underlying inflation as expected, it should support markets in the months ahead.
The Takeaway
- September data releases show signs of continued economic growth.
- Underlying inflation data continued to improve in September.
Shutdown Uncertainty Highlights Continued Market Risks
We’ve seen a number of political and economic risks impact markets throughout the course of the year, and September’s government shutdown saga was another reminder that real risks remain for investors.
After a month of political uncertainty, Congress was able to avert a government shutdown by passing a stopgap funding bill by the end of the month. The temporary measure is set to keep the federal government open through mid-November to allow for further budget negotiations. This may continue to be a source of uncertainty and potential risk for investors; however, other risks should be monitored as well.
Domestically inflation is a risk as a spike in prices could lead to additional rate hikes. While economists and investors do not currently anticipate a surge in inflation, the Fed will remain data-dependent at upcoming meetings and rate hikes are possible if we see signs that inflation is starting to accelerate. As we saw in September, rising rates can pressure stock and bond valuations and should be watched.
International risks remain as well, with the Russian invasion of Ukraine and continued economic uncertainty from China representing two of the largest current risk factors. Finally, there are also the unknown risks that can’t be predicted at this time, which always have the potential to negatively impact markets.
The Takeaway
- A government shutdown has been avoided for now, but risks remain.
- Rising inflation and rates continue to be a risk for investors.
- International and unknown risks should be monitored as well.
Solid Foundation for the Fourth Quarter
Despite the pullback for markets during the month and quarter, economic fundamentals remain solid. The continued strength of the labor market should help support continued consumer income and spending growth through the end of the year. Additionally, with business spending set to remain strong and further progress expected on inflation, the fundamentals are in place for a positive end of the year, especially if we don’t see any further rate hikes by year-end.
Looking ahead, the most likely path forward is for a return to market appreciation and continued economic growth. With that said, there are risks that remain to that outlook that could lead to short-term volatility. As always, a well-diversified portfolio that matches investor timelines and goals remains the best path forward for most. If you have concerns, you should reach out to your financial advisor to discuss your current plan.
The Takeaway
- Solid economic fundamentals should support markets through the end of the year.
- Over the long run, the outlook remains positive, with potential for short-term setbacks.
Disclosure: Certain sections of this commentary contain forward-looking statements based on our reasonable expectations, estimates, projections, and assumptions. Forward-looking statements are not guarantees of future performance and involve certain risks and uncertainties, which are difficult to predict. Past performance is not indicative of future results. Diversification does not assure a profit or protect against loss in declining markets. All indices are unmanaged and investors cannot invest directly into an index. The Dow Jones Industrial Average is a price-weighted average of 30 actively traded blue-chip stocks. The S&P 500 Index is a broad-based measurement of changes in stock market conditions based on the average performance of 500 widely held common stocks. The Nasdaq Composite Index measures the performance of all issues listed in the Nasdaq Stock Market, except for rights, warrants, units, and convertible debentures. The MSCI EAFE Index is a float-adjusted market capitalization index designed to measure developed market equity performance, excluding the U.S. and Canada. The MSCI Emerging Markets Index is a market capitalization-weighted index composed of companies representative of the market structure of 26 emerging market countries in Europe, Latin America, and the Pacific Basin. It excludes closed markets and those shares in otherwise free markets that are not purchasable by foreigners. The Bloomberg Aggregate Bond Index is an unmanaged market value-weighted index representing securities that are SEC-registered, taxable, and dollar-denominated. It covers the U.S. investment-grade fixed-rate bond market, with index components for a combination of the Bloomberg government and corporate securities, mortgage-backed pass-through securities, and asset-backed securities. The Bloomberg U.S. Corporate High Yield Index covers the USD-denominated, non-investment-grade, fixed-rate, taxable corporate bond market. Securities are classified as high-yield if the middle rating of Moody’s, Fitch, and S&P is Ba1/BB+/BB+ or below.
Authored by Brad McMillan, CFA®, CAIA, MAI, managing principal, chief investment officer, and Sam Millette, director, fixed income, at Commonwealth Financial Network®.
© 2023 Commonwealth Financial Network